
We all know the stats around business failure, but did you know that of those that have failed, 44% of them are due to insufficient cash flow?
Who hasn’t suffered the embarrassment of your card being declined in front of a friend or client? Or when you think to have enough to pay for that conference only to get stung by a large tax bill the following month.
This is a key challenge for businesses both large and small that needs to be actively managed.
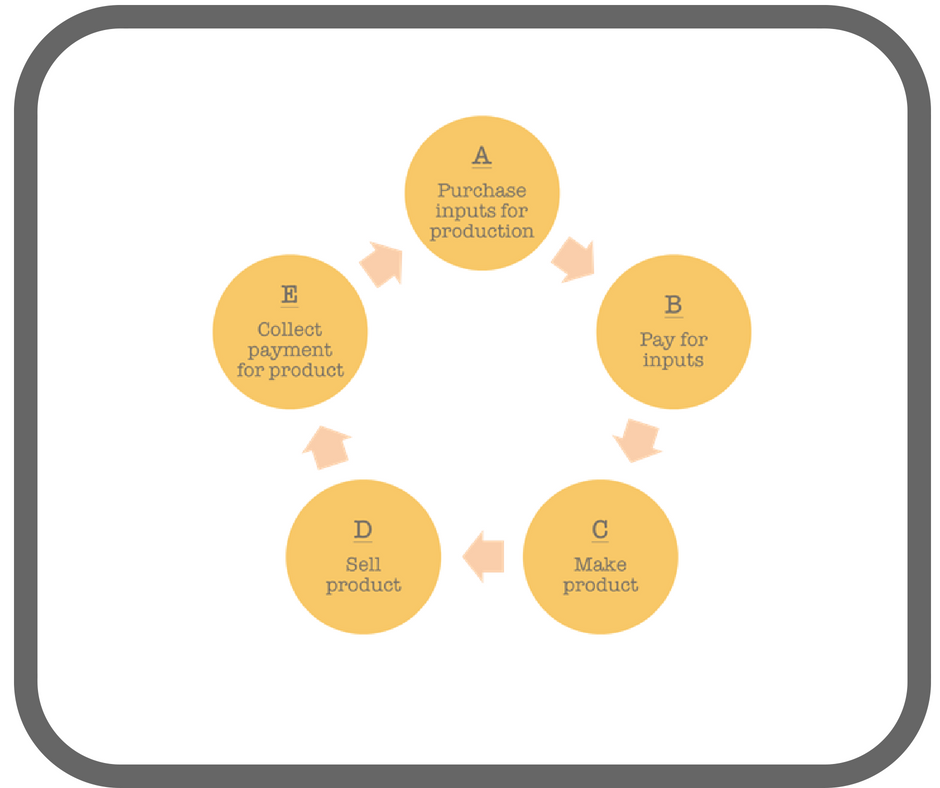
The cash flow diagram above is what is commonly referred to as the cash conversion cycle. Effectively the points of when cash flows out and cash flows back in to your business. The crux of the challenge is the time delay between “Step B: paying for inputs” and “Step E: collecting payment for your goods.”
So how do you maximise cash flow?
Planning is one thing – knowing when and what can influence your cash flow in a year is hugely important. For instance, have you planned for months when large bills come in?
Mix is another – do you have the right mix of offerings to can keep money flowing through the business? Do you have the right mix of fixed and liquid assets?
Pricing is yet another – have you included all your labour and overhead costs in your pricing?
Is cash a problem in your business? Do you feel flushed with it one month and then scratching around for a gold coin the next? It doesn’t have to be this way. Let me know your cash tips in the comments.